Complex Images
From the W3C Website Accessibility Initiative
Complex images contain substantial information – more than can be conveyed in a short phrase or sentence. These are typically:
- graphs and charts, including flow charts and organizational charts;
- diagrams and illustrations where the page text relies on the user being able to understand the image;
- maps showing locations or other information such as weather systems.
In these cases, a two-part text alternative is required. The first part is the short description to identify the image and, where appropriate, indicate the location of the long description. The second part is the long description – a textual representation of the essential information conveyed by the image.
Complex Images Need Two Descriptions
Short Description
- The normal alt text in the Alternative Description text field when adding an image to a page. Identifies the image.
Long Description
- The Long Description contains the "essential information convyed by the image." Usually this is a caption or nearby text.
Complex Image Examples
Infographics:
Infographics communicate more information than simple alt text could reasonably convey. When using an infographic, take the following steps into consideration:
- Use the normal alt text/alternative description to IDENTIFY the infographic. This does not have to be too long, give the title of the infographic and state what type of information it is displaying.
- For your long description, include all key information from your image and any important text that is part of the graphic. If possible, consider removing the text from your image and instead inserting it on your page. A screen reader will not be able to recognize the information being conveyed by the infographic, so give as much information as you can.
- Make sure to account for the layout, the way information is being presented in an infographic is often crucial to understanding what is being represented. Again, a screen reader will only know there's an image there, put yourself in the shoes of your users and walk them through what you're trying to convey by using this infographic.
An Example from LSU's Leadership Development Institute
See the example live here.

Alt Text: An image showing the sources of leadership expertise we draw on to serve our clients
Secondary Text: (Shown beneath the image on the LDI page)
Our Leadership Model - The image above is a flowchart that depicts the many ways the LSU College of Human Sciences & Education develops leaders, from every field or sector, and at any point in their career or life journey. On the left, we list our key constituent groups including students, educators, researchers, community, nonprofits, business and industry, healthcare, government, military and defense, first responders, and agriculture. In the center circle is "Leadership Development Expertise." Arrayed around the center, pointing inward, are our college units possessing the expertise that the Leadership Development Institute can draw upon to serve our clients, including the Higher Education Administration Program, the Office of Educational Research, the Educational Leadership Program, the Social Research & Evaluation Center, the School of Leadership & Human Resource Development, and the Leadership Development Institute itself. On the right, an arrow points out toward our outcomes: Student Leaders, Emerging Leaders, Mid-Level Leaders, and Senior Leaders. We serve these levels of leaders through a collective leadership development expertise. The image ends with the phrase "Engaging & Developing Louisiana's Leaders." As the flagship university for our state, we are passionate about serving our citizens and helping solve complex issues for our industiries and organizations.
Charts and Diagrams
Charts or any diagrams that are used to visualize sets of data are also considered complex images. The process for providing alt text is the same as the Infographic, with the added requirement of providing the data contained in the chart.
- For the alt text/alternative description field, identify the type of chart/diagram you are using as well as the type of data it is displaying.
- For the long description, you can use either a detailed text description or a data table.
- Detailed Text Description: Write out the information in a caption or text close to the image. You can also provide a link to a separate page if your text description is long enough to distract from the actual page.
- Data Table: A data table is a great and simple way to display the information in an accessible way.
An Example from the Shirley C. Tucker Herbarium
See the example live here.
Alt Text: Pie Chart detailing herbarium composition.
Image with long description in caption.
Alt Text: Pie Chart detailing herbarium composition.
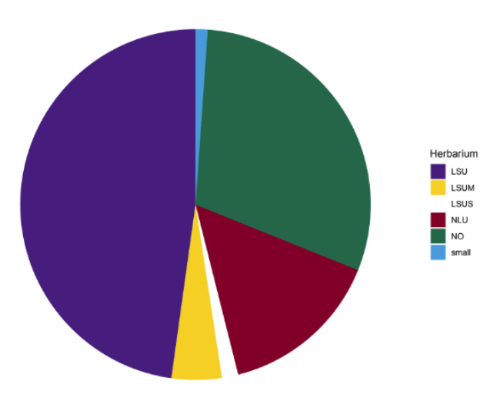
Chart of accessioned collections - Tulane University - NO entire (120,000); University of Louisiana, Monroe - NLU, parital (55,106); Eglin Air Force Base, Florida entire (1,737), Louisiana State University Shreveport – LSUS partial (6,000), Tall Timbers Research Station, Florida partial (1,018), McNeese State University - MCN entire (1,223), University of Louisiana, Lafayette - LAF bryophytes partial (492).
– Shirley C. Tucker's herbarium
Or, you could use a Table for your long description:
Shirley C. Tucker Herbarium Collections by the Numbers:
| Collection | Number of Specimens |
|---|---|
| Tulane Universit - NO entire | 120,000 |
| University of Louisiana, Monroe - NLU, partial | 55,106 |
| Eglin Air Force Base, Florida entire | 1,737 |
| Louisiana State Univeristy Shreveport - LSUS partial | 6,000 |
| Tall Timbers Research Station, Florida partial | 1,018 |
| McNeese State University - MCN entire | 1,223 |
| University of Louisiana, Lafayette - LAF bryophytes partial | 492 |